Lesson / WY-03-13
Accumulation is a candidate process: the preceding decline is first halted and price enters a trading range; repeated tests gradually weaken supply within the range, demand begins to lift price, and may eventually lead it out of the range. Charts show these market behaviors. They cannot show how much a particular institution has bought, its average cost, or verify its subsequent plans. The Composite Operator hypothesis can explain why large transactions often need to be spread out, but specific judgments must still rest on price, volume, and subsequent action.
Course content is for learning and research only. It is not investment advice.
Read the Chapter ↗Timestamps
8 lessons · Chapter contents
01Phases and Events in the Accumulation Schematic↗02The Task of Phase A: Has the Decline Stopped?↗03Preliminary Support: PS↗04Selling Climax: SC↗05Automatic Rally: AR↗06Secondary Test: ST↗07Establishing and Revising Preliminary Range Boundaries↗08Nonstandard Phase A Structures↗Observe the market: start with context and place price within its structure.
Understand structure: compare supply and demand, and let evidence support or revise your hypothesis.
Form a view: define risk limits and know when to reassess.
No matching captions.
Phase B: Tracking Supply and Demand Within the Range
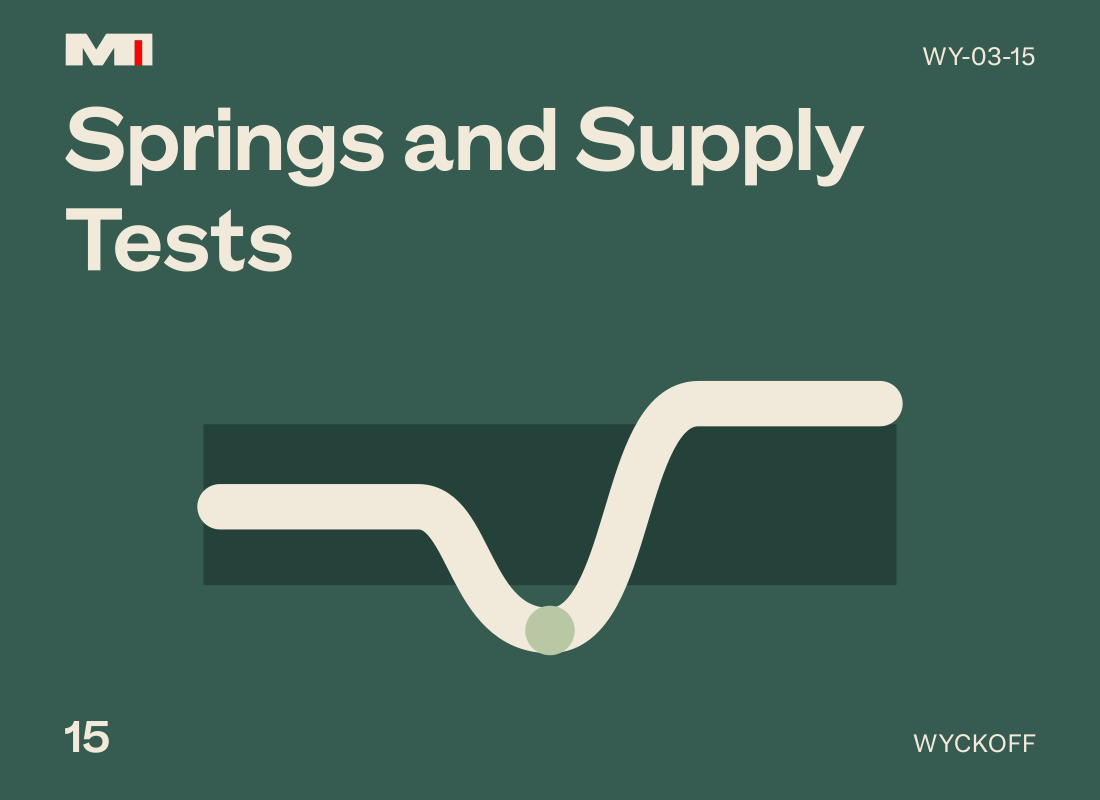
Phase C: Springs and Supply Tests