WY-02-09 / 04
Baselines: Previous Averages, Adjacent Swings, and Matching Session Periods
Price & Volume
Lesson / WY-02-09
Average historical volume describes the center of recent activity but is affected by window length and extreme events. The arithmetic mean reflects overall activity but may be pulled up by a few exceptional observations. The median is the middle ordered value and more resistant to spikes. A large difference between them indicates skewness. Retain anomalous events alongside the comparison rather than hide them in one average.
Course content is for learning and research only. It is not investment advice.
Read the Chapter ↗Timestamps
7 lessons · Chapter contents
01Volume, Turnover Value, Trade Count, and Open Interest↗02Actual Trade Records, Tick Volume, and Data Coverage↗03Absolute and Relative Volume↗04Baselines: Previous Averages, Adjacent Swings, and Matching Session Periods↗05Recording Expanding, Contracting, and Abnormal Volume↗06Combining Volume with Price, Location, and Subsequent Behavior↗07Data Anomalies, Contract Rolls, and Other Checks↗Observe the market: start with context and place price within its structure.
Understand structure: compare supply and demand, and let evidence support or revise your hypothesis.
Form a view: define risk limits and know when to reassess.
No matching captions.
A Fresh Look at a Single Candlestick
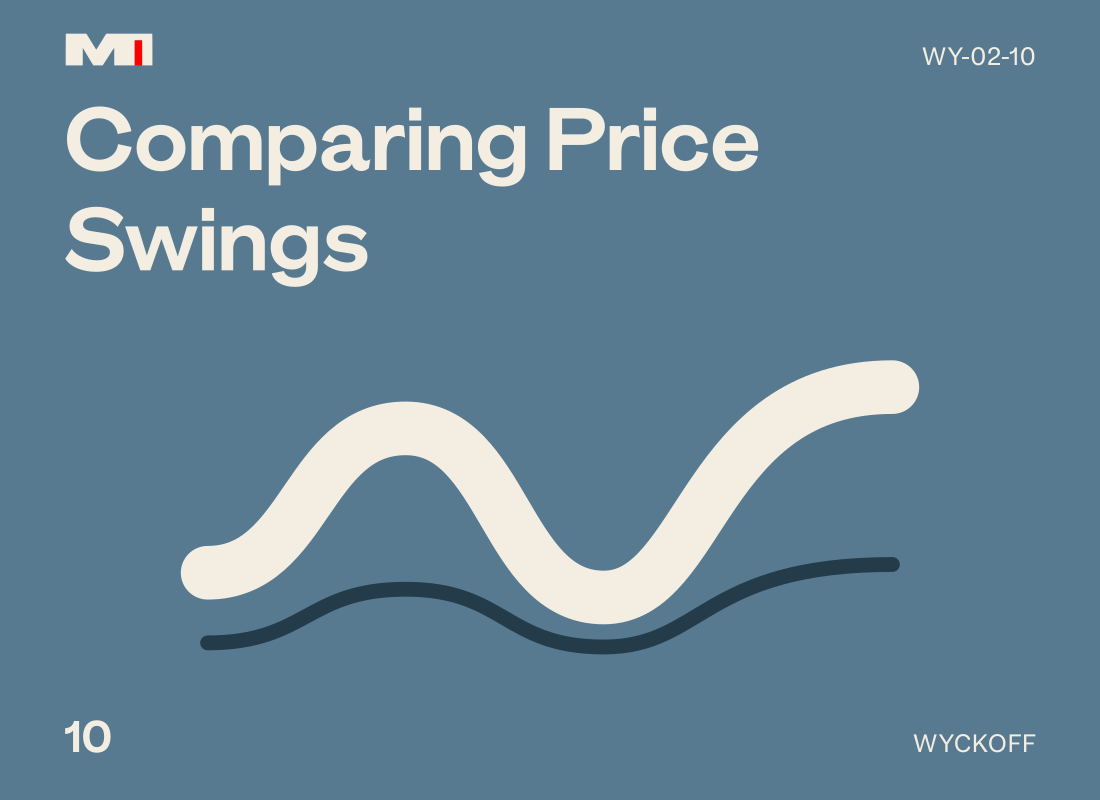
From Single Candlesticks to Swing Comparisons